THIS ARTICLE AT A GLANCE
CONTACT ETS
If you have any questions or would like to discuss further what you should be doing, ETS is here and willing to help.
Call 0117 205 0542
Email enquiries@energy-ts.com
Submit a contact form
CHECK OUR SERVICES
Accelerating Net Zero Progress: Utilising Data Models for Effective Planning and Carbon Reporting.
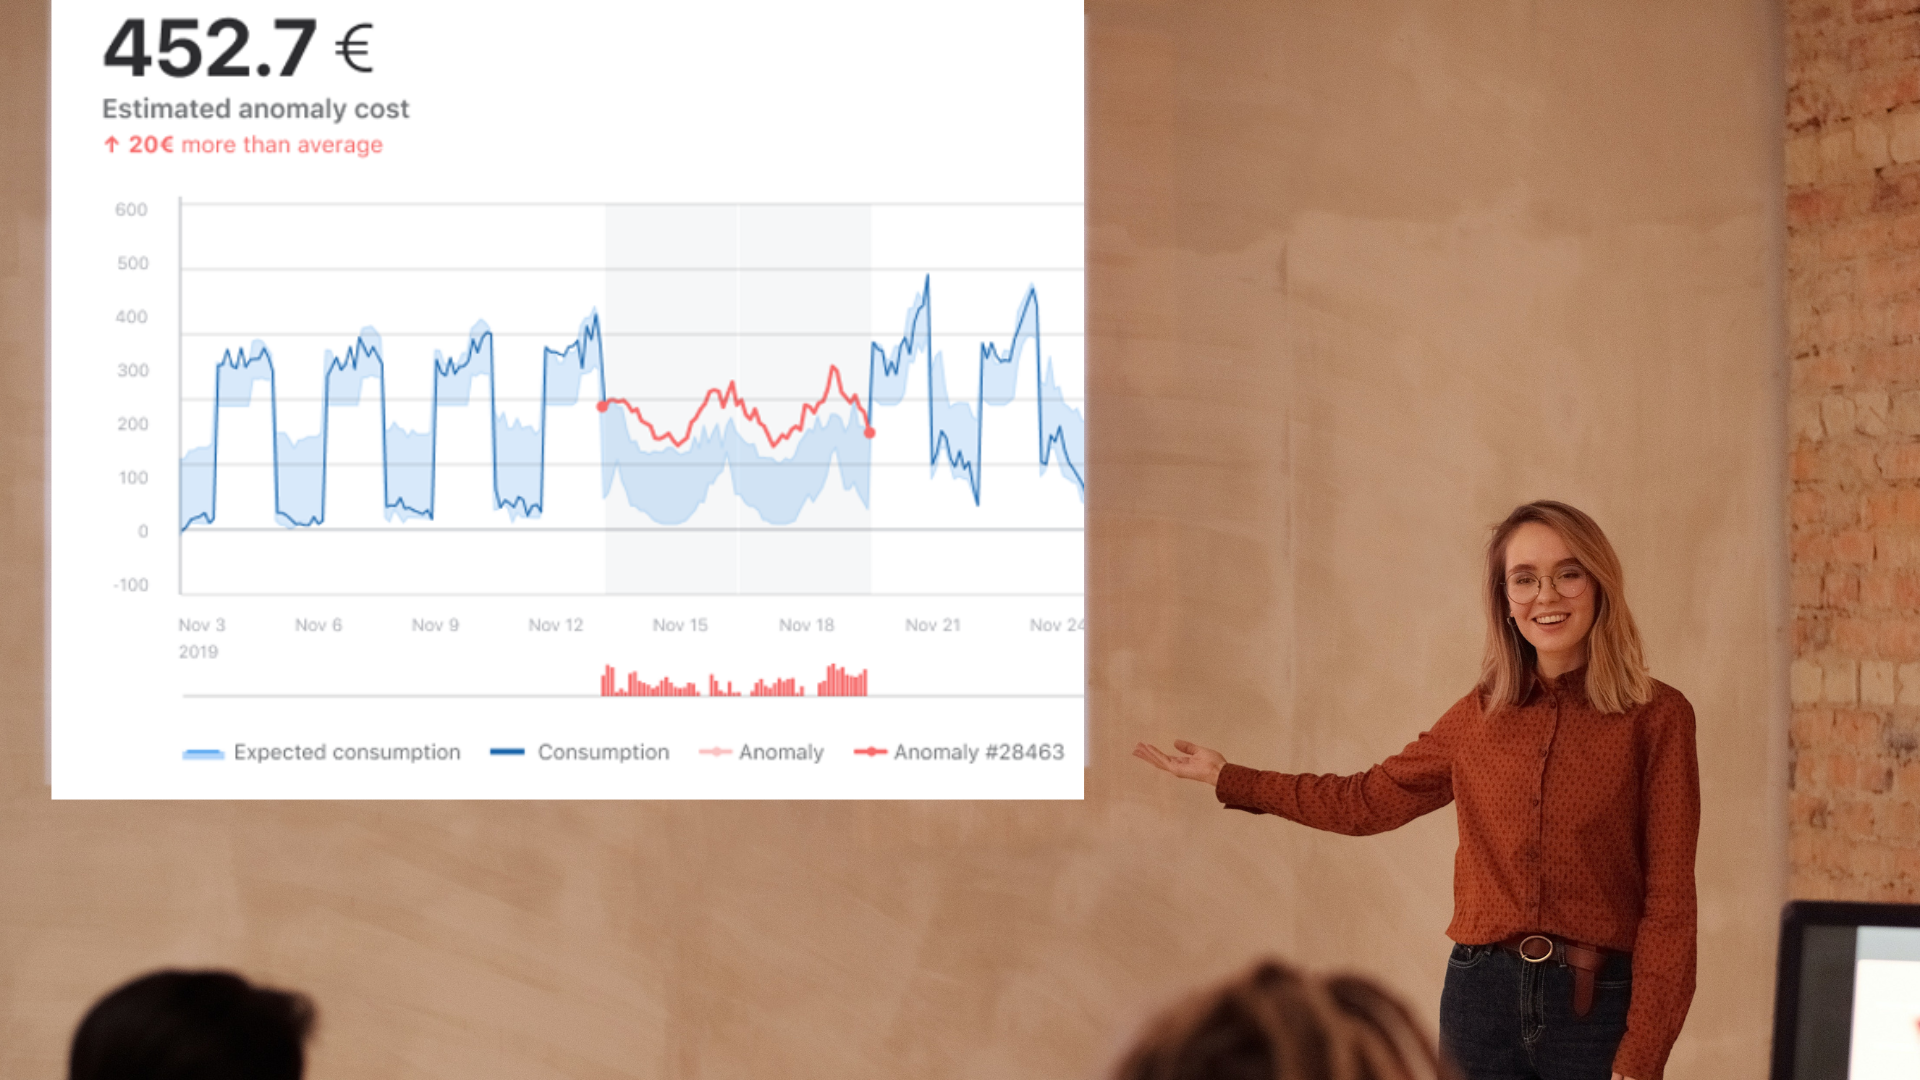
Every business will forecast how much energy they expect to use (or how much they expect to spend on energy at least) for their financial planning. But an energy forecast can be used for so much more than just calculating expected costs each financial year.
We work in an industry where we are trying to reduce energy consumption, cost, and carbon emissions as much as possible. Any saving is a success, but there is almost always more we can achieve. So, is the job ever finished if we know we could be achieving even more?
Fortunately, we now have a clear and ambitious long-term goal of achieving Net Zero. If your organisation is following the SBTi (Science Based Targets Initiative) then you will have set both long-term and short-term targets. The long-term target is often a key milestone, such as Net-Zero in Scope 1, 2 or 3 emissions by a specific year, but the short-term targets are calculated to allow you to “check-in” and confirm whether you are on track to achieve those long-term goals at regular intervals.
Historically, short-term goals have been an annual target of x% energy reduction year-on-year. Now that these are instead being scientifically calculated to ensure progress towards Net-Zero, it is important to understand your progress against these goals ahead of time – rather than finding out you are on or off target at the end of the year.
A good forecast will factor in the impact of any changes to the estate (e.g., building/purchasing new sites, or closing existing sites) or to specific sites (all planned site works, such as asset maintenance, upgrades, and removal). The result is your best estimation of expected consumption. Therefore, if your forecast model is up to date, you can compare your expected performance against targets at regular intervals to ensure you are on track to achieve these in advance, and if not, you will be able to make the necessary adjustments.
A good target is realistic and achievable but is also clearly communicated. If you never discuss or reference your targets, it is very easy to lose sight of what you are aiming for. Once you have validated your forecast against target, you can use the forecast as the benchmark in your reports. This changes the focus of your reports from looking behind at what you have done before, to looking forwards and comparing yourself to where you want to be – and ensuring that your targets and performance against those targets are clearly visible throughout the business.
I’ve discussed a lot about how forecasting can support with implementing, tracking, achieving, and reporting against short-term targets above. But there is nothing stopping you from using this model to forecast multiple years into the future and compare your current progress against your long-term targets and goals. You will need a similar process to validate your new short-term targets against your long-term goal, so there is no reason you shouldn’t use the same forecasting model.
The further out you forecast for, the more assumptions you need to make, but the basis of the data model will be the same. This data will then be the supporting evidence required for any business case to justify an increase in CapEX or OpEx expenditure for your business to achieve its Net Zero target.
Finally, there are several different ways that you can forecast your consumption. The more granular the level of detail that goes into the model, the more control you have over the different scenarios you can simulate.
For example, if your sites have different consumption profiles on weekdays compared to weekends then using daily data would allow you to reflect the number of weekdays/weekends in a month when forecasting for monthly consumption. But if you’re only using monthly data and compare year-on-year, you will see variances within the expected totals due to the differences in weekends in each month throughout the year. When using half-hourly data, you could model changes in operating hours of different assets on site, and the effect this would have on total consumption.
Estimated Energy Costs on our Energy Data Portal (Dexma)

Site Electricity Forecasting Report.

Final thoughts
At ETS, we provide a range of services inherent to reducing energy consumption and carbon emissions, using smart solutions. Our experienced team of Energy Managers are well-equipped with legacy systems and smart energy management tools that can continually monitor and respond to real-time granular energy consumption of your assets. We also house a team of ISO50001 lead assessors that can ensure that your business shows a robust commitment to energy and carbon management through a bespoke package that also reflects your business goals.
To discuss your requirements, get in touch. You can contact us by calling 0117 205 0542 or drop us an email at enquiries@energy-ts.com.
Related Article
8 Ways Businesses Can Reduce Energy Use in the Workplace This Winter
Discover how to comply with ESOS Phase 4 and unlock energy-saving opportunities for your business. This guide explains the requirements, highlights key deadlines, and provides actionable strategies. Learn how energy audits, tailored action plans, and expert support can reduce costs, improve efficiency, and align your organisation with sustainability goals.
ESOS Action Planning: Complying with Phase 4 and Implementing Energy Saving Strategies
Discover how to comply with ESOS Phase 4 and unlock energy-saving opportunities for your business. This guide explains the requirements, highlights key deadlines, and provides actionable strategies. Learn how energy audits, tailored action plans, and expert support can reduce costs, improve efficiency, and align your organisation with sustainability goals.
Important Update: What You Need to Know about ESOS Phase 3
Time is ticking for the ESOS Phase 3 deadline. The Environment Agency announced that the reporting system is available now. For organisations qualifying for ESOS Phase 3, the deadline for submitting a compliance notification is 5 June 2024, and organisations should still look to meet this compliance notification deadline where possible.


